
TypeMotion.Art
Guide · real product workflow

How to Make Animated Charts

Choose the right chart and animate data in the order your audience should understand it.

Open Animated Chart Maker
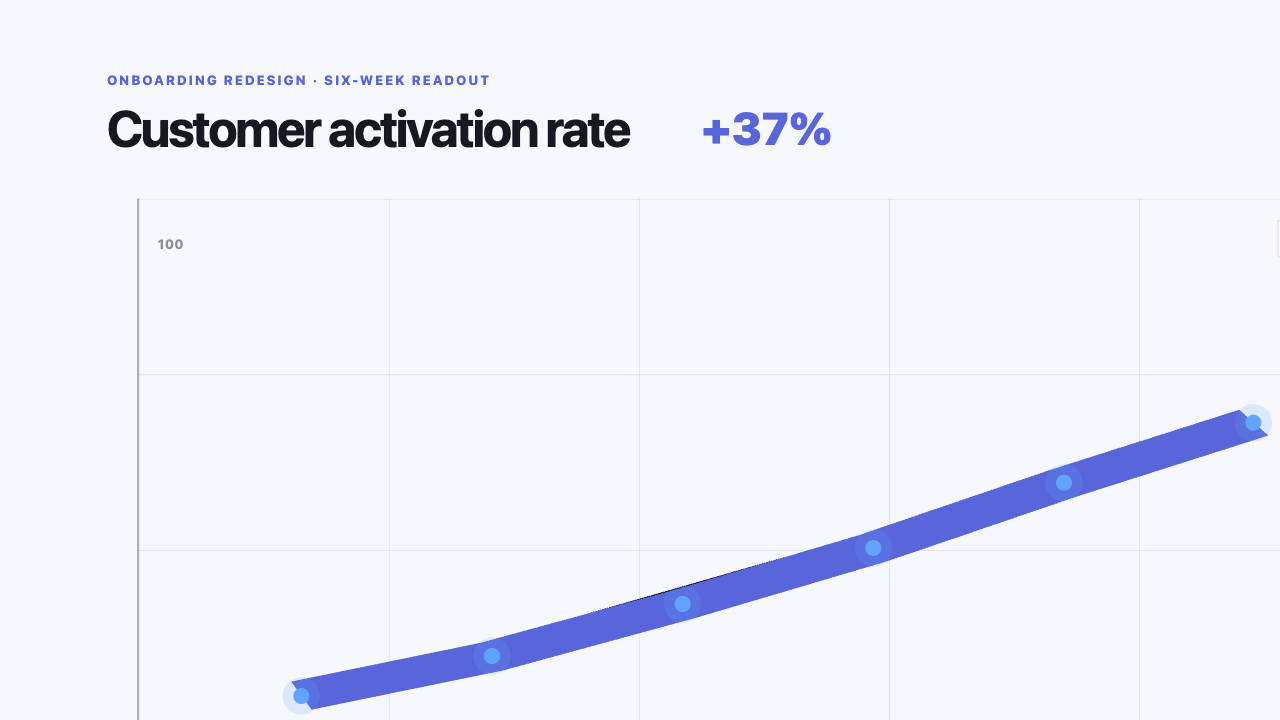
Real MP4 exportA six-week activation trend16:9 · 24 FPS · Built in TypeMotion.Art
Open the real editor
01

Choose the comparison first

Use lines for change over time, bars for category comparison, stacked charts for composition, Sankey diagrams for flow, and counters for a single headline metric.
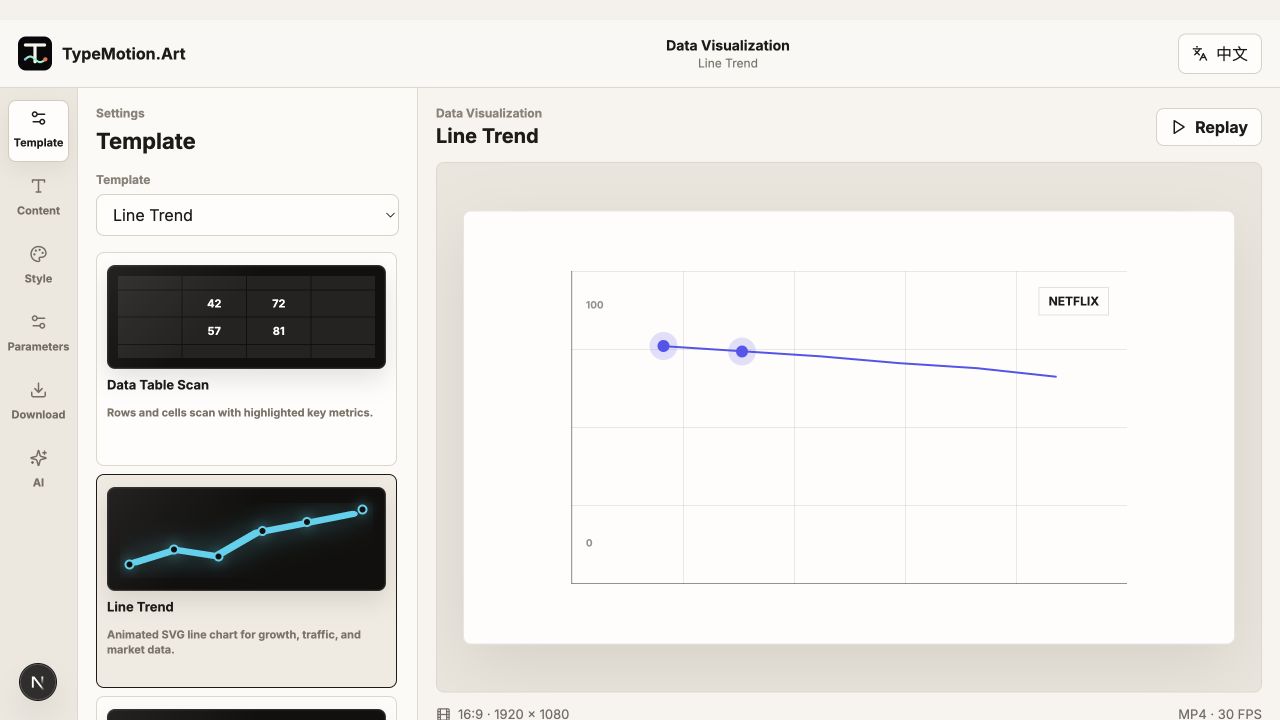
Choose the comparison first shown in the TypeMotion.Art Data Visualization editor
Actual product UILine TrendActual TypeMotion.Art editor screenshot
02

Reduce before animating

Remove rows, decimals, grid lines, and labels that do not support the takeaway. Animation cannot rescue a chart whose comparison is unclear.

Reduce before animating shown in the TypeMotion.Art Data Visualization editor
Actual product UIDynamic Bar ChartActual TypeMotion.Art editor screenshot
03

Animate in reading order

Introduce the frame and axes, then the data, then the annotation or takeaway. For rankings and bar races, keep enough time between changes for viewers to track position.
Animate in reading order shown in the TypeMotion.Art Data Visualization editor
Actual product UISankey FlowActual TypeMotion.Art editor screenshot
Try it

Templates used in this guide

Each link opens the working SaaS editor rather than a decorative demo card.

Finished result

A real export built with this workflow

A six-week activation trend exported frame
Exported video frameA six-week activation trend16:9 · line-trend
Apply the workflow

Related use cases